



What the latest country carbon data says about your own footprint
/How big is a "normal" carbon footprint? The most complete answer comes from the Global Carbon Budget, which the Global Carbon Project, an international team of climate scientists, publishes every year. Its latest edition, released in November 2025, covers every country up to 2024. It projects that fossil CO₂ emissions reached a new record of 38.1 billion tonnes in 2025, 1.1% more than in 2024.
National totals and per-person averages are a useful mirror for our own habits. Here is what the figures show, and what they mean for the choices we make at home.

Hanny Naibaho @unsplash
The biggest emitters
In 2024, China emitted 12.3 billion tonnes of CO₂ from fossil fuels and industry. That is about 32% of the world total, and more than the United States, India and Russia combined. The United States followed with 4.9 billion tonnes and India with 3.2 billion.
Together, the ten largest emitters produced about 69% of the world's fossil CO₂. Counted as a single bloc, the 27 countries of the European Union emitted 2.43 billion tonnes, which would place them fourth.
Per person, the ranking changes
Totals follow population size. Divide them by the number of people and a different picture appears. The world average in 2024 was 4.7 tonnes of CO₂ per person.
Among countries with at least one million inhabitants, the highest figures come from oil- and gas-producing states with small populations: Qatar emitted 41.3 tonnes per person, Kuwait 26.2 and Bahrain 24.3. Large, wealthy economies come next. Australia emitted 14.5 tonnes per person, the United States 14.2 and Canada 13.4, roughly three times the world average.
China, at 8.7 tonnes per person, is now well above the EU average of 5.4. At the other end, India emitted 2.2 tonnes per person, and Africa as a whole about 1 tonne, for a population of 1.5 billion.
These figures count carbon dioxide only. Adding methane, nitrous oxide and land use raises the world average to about 6.7 tonnes of CO₂-equivalent per person, according to a 2025 study by Jones et al. To see where your own country sits, this breakdown of how carbon footprints compare by country has the full tables for the largest emitters, the per-person ranking and Europe.
Your footprint includes what you buy
National statistics count emissions where they are produced. But much of what we buy is made somewhere else. When researchers move the emissions of traded goods to the country where they are bought, the footprints of many wealthy countries grow.
In 2023, the latest year with these figures, the United Kingdom produced 4.5 tonnes of CO₂ per person but consumed 7.1. Switzerland produced 3.6 tonnes and consumed 13.3. In the United States, the figures were 14.3 and 15.8. For exporters, it works the other way: China produced 8.6 tonnes per person and consumed 7.6.
That matters for anyone trying to live more sustainably. A personal carbon footprint is a consumption-based number: it includes the food, clothes, electronics and services you pay for, wherever they were made. Buying fewer things that last longer is a climate decision as much as a budget one.

Documerica @unsplash
Where the emissions come from
Of the world's fossil and industrial CO₂ in 2024, 41% came from coal, 32% from oil, 21% from natural gas, 4% from cement production and 2% from gas flaring and other industrial processes.
Coal is mostly burned in power plants and heavy industry. Oil dominates transport, which is why driving and flying weigh so heavily in a household's footprint.
Where to start at home
National averages are the sum of millions of individual decisions about energy, travel, food and shopping. Three steps turn the numbers into action.
Measure. A free carbon footprint calculator, such as the one from Coffset, shows in a few minutes how your household compares with your country's average, with no account needed. The result is an estimate, not an audited inventory, but it shows which parts of your life weigh the most.
Reduce the big items first. For most households these are heating and electricity, flights, car use and diet. Better insulation and a well-maintained heating system, fewer flights, more trips on foot, by bike or by public transport, and more plant-based meals usually matter more than small everyday swaps.
Fund climate projects for what remains. For emissions you can't avoid yet, you can buy carbon credits. Each credit represents one tonne of CO₂-equivalent reduced or removed by a certified project, and it should be retired on a public registry so it can't be sold again.
How to tell good carbon credits from weak ones
Carbon credits are not all equal, so it pays to check a few things before you buy:
Standard: the credit should be issued under a recognised standard, such as Verra's Verified Carbon Standard or Gold Standard.
Retirement: the provider should retire it on a public registry, with a unique serial number, and show you where.
Independent review: rating agencies such as BeZero, Calyx Global, Renoster and Sylvera assess whether projects deliver what they claim.
Mix: a portfolio spread over several projects and countries, including some carbon removal, limits the risk of relying on a single project.
Coffset, a company based in Tallinn, Estonia, retires credits through CNaught from a portfolio certified under standards including Verra's Verified Carbon Standard, Gold Standard, Climate Action Reserve and Puro.earth, and every purchase comes with a certificate.
What credits can't do is undo emissions that have already happened. They fund projects that cut or remove carbon elsewhere. That is why reducing comes first, and credits are for the part you can't avoid yet.
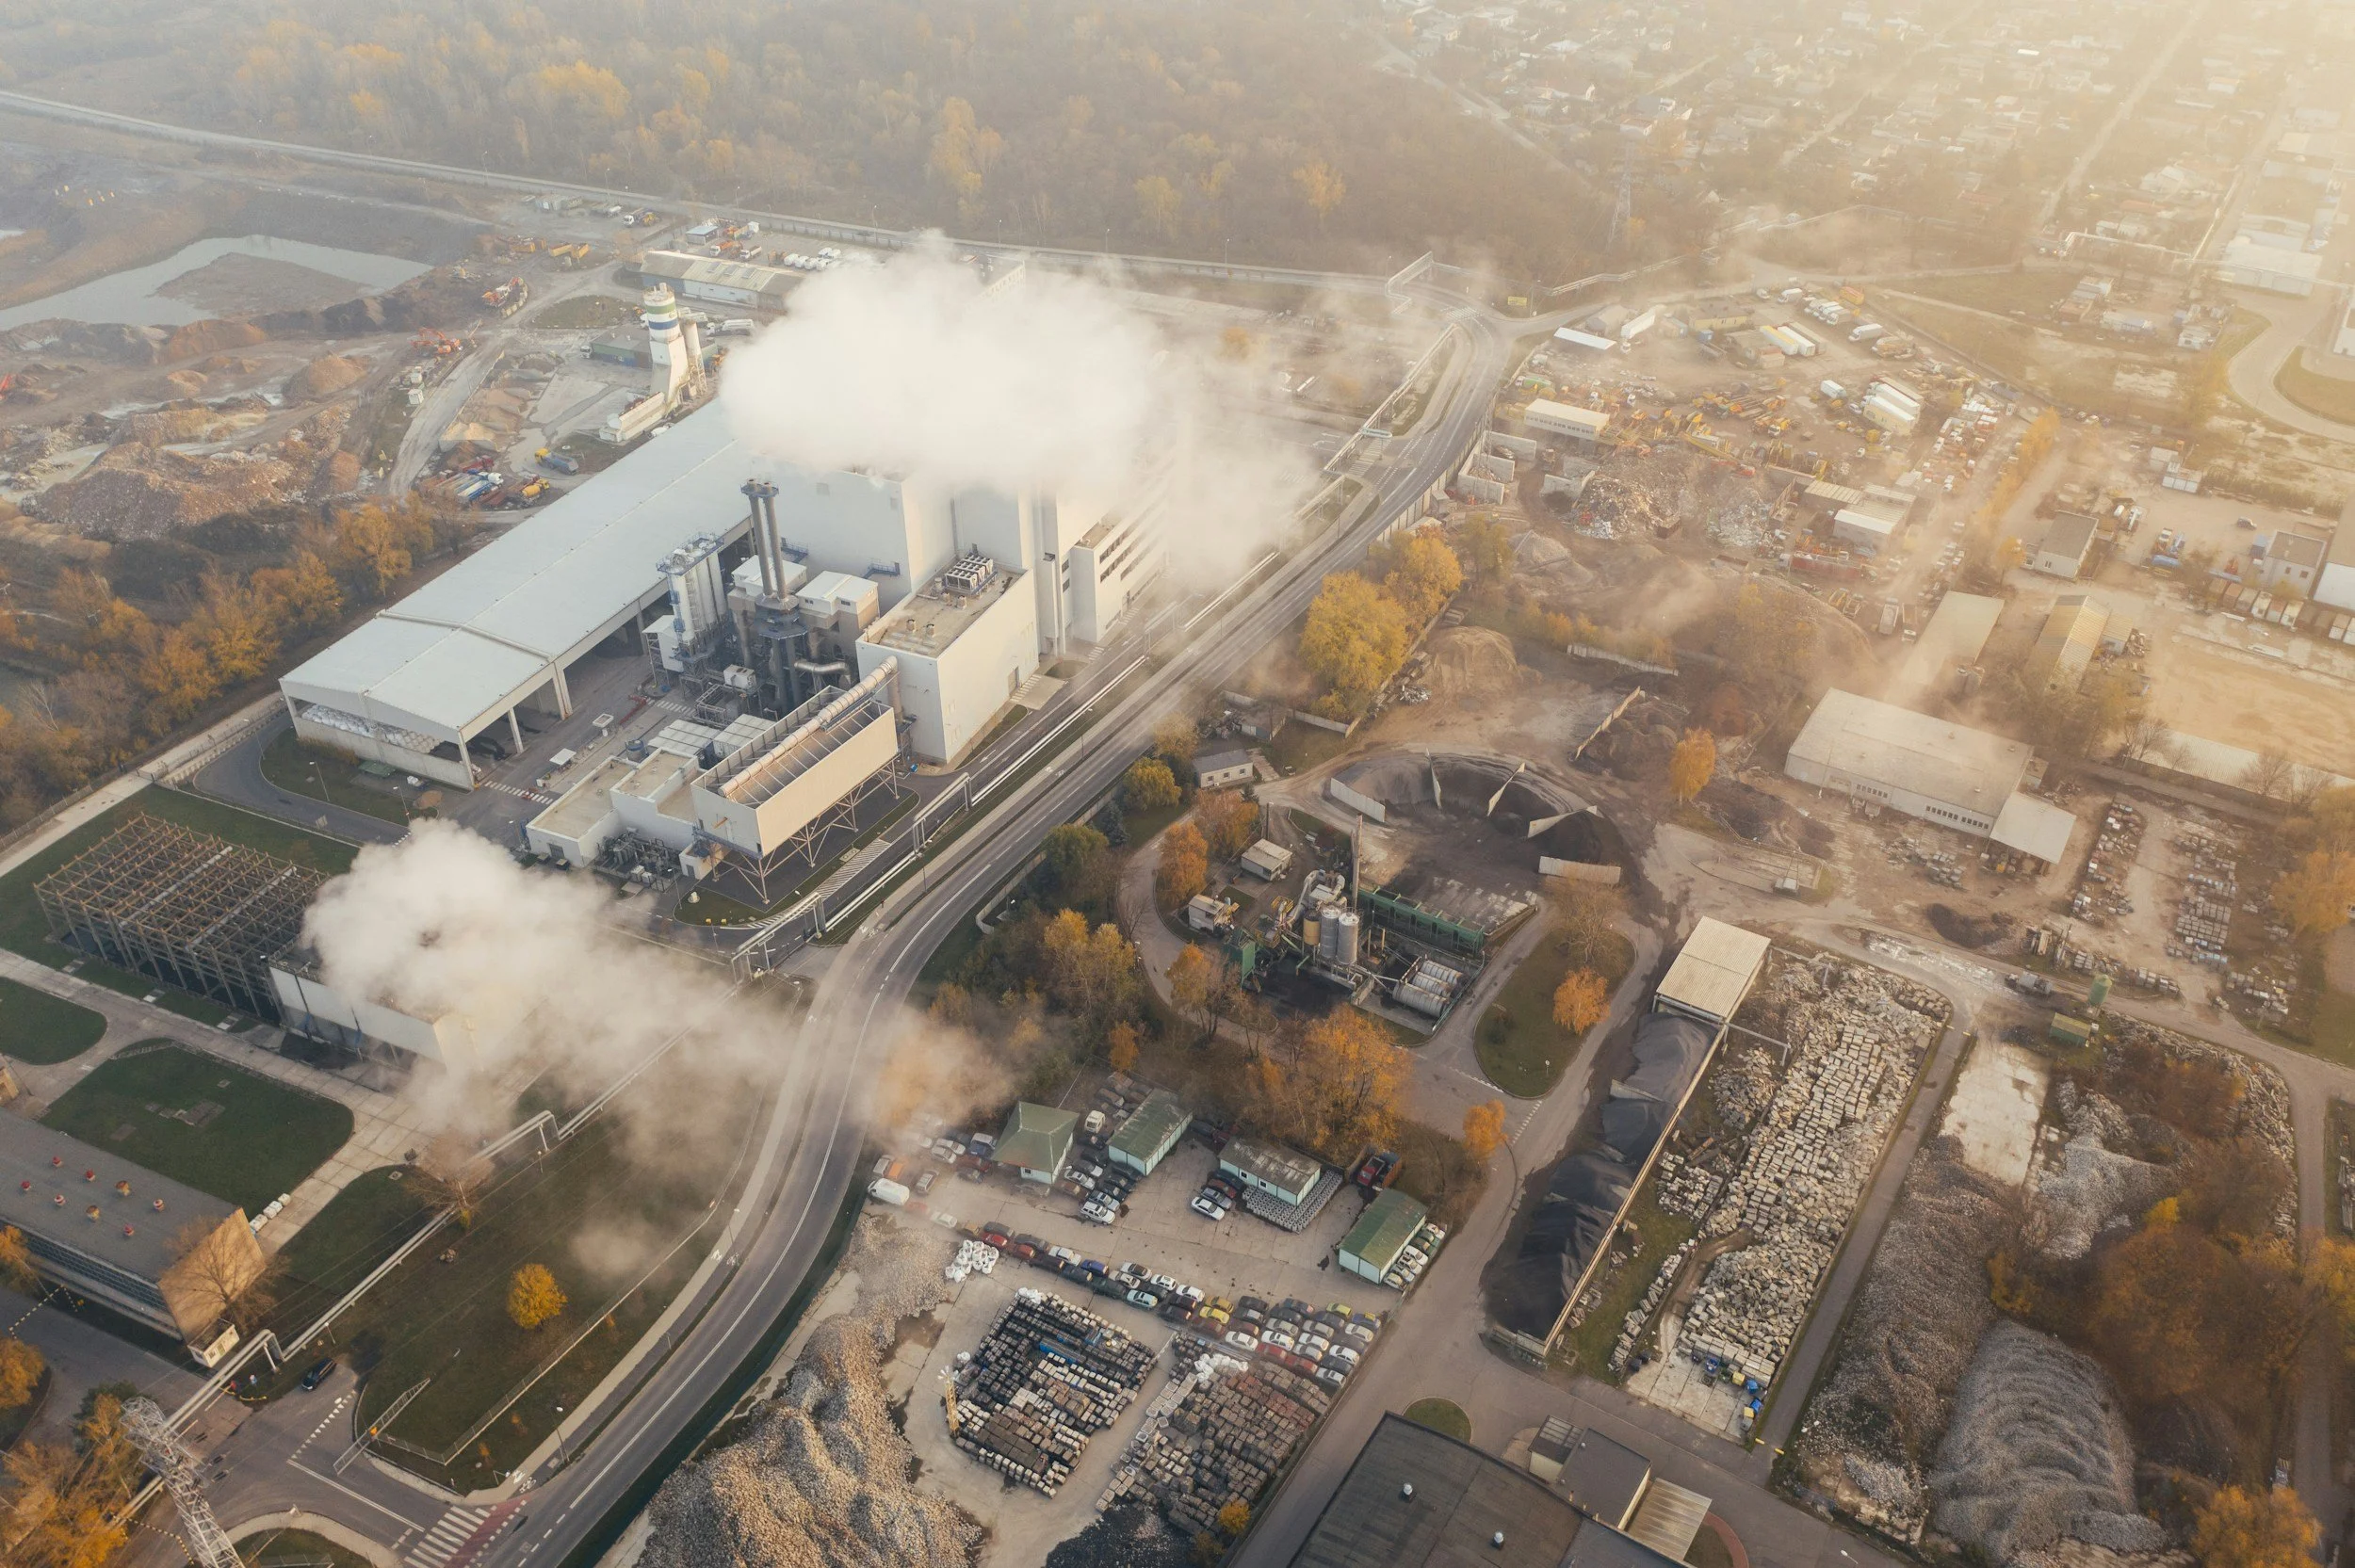
Marcin Jozwiak @unsplash
Why the next few years matter
The Global Carbon Budget also estimates how much CO₂ the world can still emit while limiting warming to 1.5 °C: about 170 billion tonnes, roughly four years of emissions at the 2025 level. Between 2015, when the Paris Agreement was signed, and 2024, global fossil CO₂ emissions rose by about 9%. The decline the Paris targets require has not started yet.
No household can close that gap alone. But knowing your number, and where it comes from, is the most practical place to start.
About the Author:
Agustin Fernandez is an Argentine engineer with PfMP® and PMP® certifications. He specializes in leading global teams, aligning project portfolios with business objectives, and scaling operations to achieve meaningful results.